
The Data tab is the place for reviewers and administrators to create ad hoc reports to use in the application review and management process. Admins can also use the data tab to export data.
How It Works
When creating a custom report, you choose the:
- Filter – Which applications to include in the report
- View – How to present the results
- Fields – What data to include
How To Use It
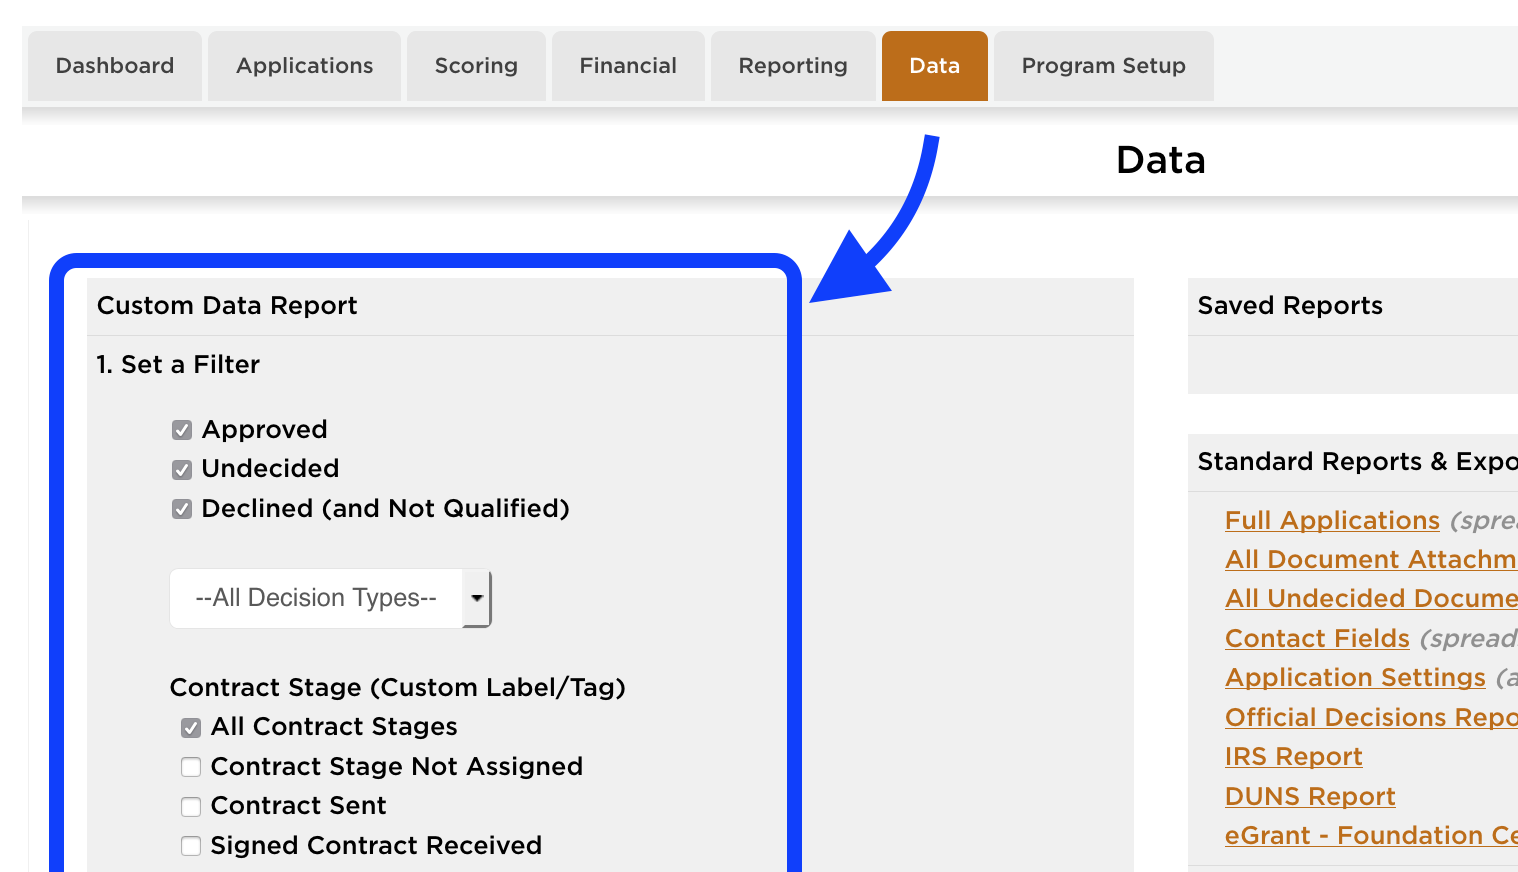
Click into the Data tab within a program, then…
- Set a Filter – Which group of applications do you want included in the report?
OR
Select an Individual Submitted Application – Create a report for individual applications submitted to the program. - Choose a View – In what layout do you want the results presented?
Printer-FriendlyAll results presented in a simple format with data from each application separated by a page break, horizontal line, or nothing, depending on the settings selectedTableAll results presented in a table format, with each field presented in its own sortable column (click a bold column header to sort by that column)TotalsNumeric table and multiple-choice and checkbox data totaled and presented on a single totals sheet with pie and bar charts to help visualize the data (text fields are not included)Export as .CSVAll results exported into a .CSV (spreadsheet) file, with each field in its own column and each application on its own line (read our CSV Manipulation Guide to learn how to manipulate the exported data)Public-FacingAll results presented as a list of the application links that, when clicked, display the proper data from that application. You can post the URL of this report online or use the embed code generated to allow the public to view the selected data.
- Select the Fields – Which fields would you like included in the report?
- Check the box next to any field to include that field in the Custom Report, keeping in mind the few restrictions regarding which questions can be sent to specific views, as indicated in the tab.
- Organization/Agency Name and Application Title are automatically included in all but the Totals View reports.
- Save the Report (available to admins only) – If you want to save this report, what do you want to call it?
- Check the box at the very bottom of the fields list to save the report, then enter a report title.
- If you’ve chosen to create a Public-Facing report, it will be saved automatically, so you can skip this step.
- Once saved, the Saved Report will appear on the Dashboard and in the Saved Reports section of the Data tab for all committee members.
- Click Generate Report to create your report.